本文共 4895 字,大约阅读时间需要 16 分钟。
/*
轮播图插件:
下载轮播图插件(不要下载最高版本的,因为高版本的使用的是swiper4文档)
npm install vue-awesome-swiper@2.5.4
vue-awesome-swiper文档:https://github.com/surmon-china/vue-awesome-swiper
https://blog.csdn.net/qq_41108402/article/details/80546626
项目中:
1,先在入口文件(main.js)引入
顺序是先引入,再调用css
import VueAwesomeSwiper from ‘vue-awesome-swiper’
import ‘swiper/dist/css/swiper.css’
(这个css路径根据node_modules中的swiper里面的css路径,如果报错,查看node_modules中的swiper路径)
Vue.use(VueAwesomeSwiper);
(使用Vue.use注册一下VueAwesomeSwiper,目的是供全局使用)
2,创建Swiper.vue
3,在首页引入Swiper.vue
import Swiper from ‘…/base/Swiper’;路径自己定
(注意:Swiper.vue中导入的是Swiper)
在首页中components注册一下Swiper组件,最后使用
*/
/----------------------------------------------------------------------------------------/
用具体详细步骤来操作如下:
1.npm install vue-awesome-swiper@2.5.4
2.npm install axios
3.min.js文件引入
// The Vue build version to load with the `import` command// (runtime-only or standalone) has been set in webpack.base.conf with an alias.import Vue from 'vue'import App from './App'import router from './router/index.js'import 'swiper/dist/css/swiper.css'import VueAwesomeSwiper from 'vue-awesome-swiper'Vue.use(VueAwesomeSwiper) //vue的第三方插件专门供vue使用Vue.config.productionTip = false/* eslint-disable no-new */new Vue({ el: '#app', router, components: { App }, template: '<App/>'})4.创建一个swiper.vue
<template> <swiper :options="swiperOption"> <swiper-slide v-for="(slide, index) in swiperImgs" :key="index"> <!-- :动态获取图片 --> <img :src="slide.src"/> </swiper-slide> <div class="swiper-pagination" slot="pagination"></div> </swiper></template><script> export default { name: 'carousel', props:['swiperImgs'],//子组件接收父组件的值 data() { return { swiperOption:{ // 参数选项,显示小点 pagination:'.swiper-pagination', //循环 loop:true, //每张播放时长2秒,自动播放 autoplay:2000, } } } }</script><style lang="less" scoped> img{ width: 100%; display: block; }</style>5.放入你要引入的主文件 我写入的是home.vue
<template> <div class="home"> <!-- 头部 --> <Top> <h3>首页</h3> </Top> <!-- 轮播图 --> <div class="swp"> <!-- 传入图片定义swiperimgs --> <Swiper :swiperImgs="bannerlist"></Swiper> </div> </div></template><script> import Top from '../base/Top'; import Swiper from '../base/Swiper'; // 因为用变量导出,所以引入的时候必须用对象来引入{导出的}地址 import {getBanner} from '../api' export default { name: 'Home', data () { return { bannerlist:[]//接收数据 } }, components:{ Swiper,Top }, //初始化之后 created(){//函数 this.getb(); }, methods:{//methods自定义方法 getb(){//定义的方法 return getBanner().then((res)=>{//必须用return 返回那个方法getbanner.成功或失败then方法,在使用箭头函数来获取拿到参数res this.bannerlist=res.data.banner; }) } }}</script><!-- Add "scoped" attribute to limit CSS to this component only --><style scoped lang='less'>.home{ width: 100%; .swp{ margin: 60px 10px 10px 10px; font-size: 16px; }}h1, h2 { font-weight: normal;}ul { list-style-type: none; padding: 0;}li { display: inline-block; margin: 0 10px;}a { color: #42b983;}</style>6.在src下创建一个(放入json文件)的api->index.js
index.js
import axios from 'axios'//导出一个axios有很多,所以必须分开用变量来接收,不用default是导出全部export let getBanner=function (){//用get接收json数据 return axios.get('/static/mock/banner.json');}7.在static静态文件下创建一个mock文件->banner.json
banner.json
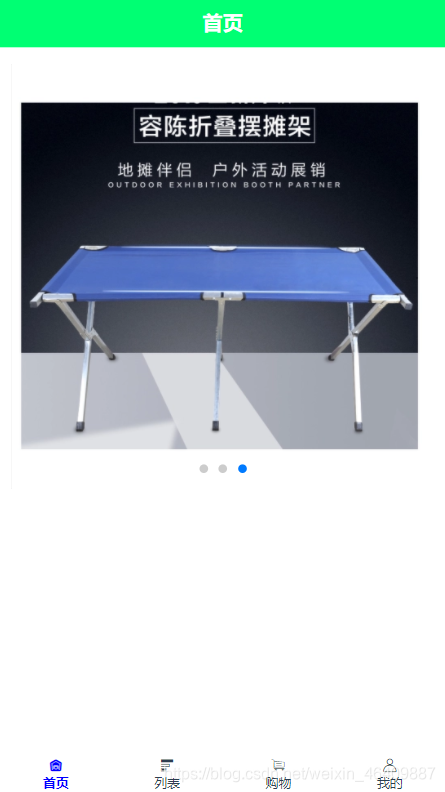
{ "banner":[ {"src":"https://img11.360buyimg.com/n2/s372x372_jfs/t1/59714/19/15384/96258/5dcd8916Ec8adb87c/19eb1d2ab0baf01c.jpg!q70.dpg.webp"}, {"src":"https://m.360buyimg.com/mobilecms/s750x750_jfs/t22045/307/929094700/422408/3bc9906d/5b1be210Nf5b61f6c.jpg!q80.dpg.webp"}, {"src":"https://img12.360buyimg.com/mobilecms/s519x519_jfs/t1/119364/38/3338/552423/5ea7e439Ef85df0e7/3759b12c3c3d84bf.png.webp"} ]}8.效果图如下:
//扩展当有很多接口图片时,使用方法如下:
index.js
import axios from 'axios'// 创建公共的接口名axios.defaults.baseURL="/static/mock/";//请求的拦截(接口)axios.interceptors.request.use((config)=>{//一般是加请求头参数 //当你有共同的参数时可以用此参数来用 config.headers.a="1234" console.log(config);//可以找到a的值1234 return config})//每次数据拿到的值都是data,也可以创建一个公共的//data已经拿到数据的响应axios.interceptors.response.use((res)=>{//数据响应的拦截 //return 啥就返回啥 return res.data;})//axios是封装的promise//导出一个axios有很多,所以必须分开用变量来接收,不用default是导出全部export let getBanner=function (){//用get接收json数据 return axios.get('banner.json');}export let getBanners=function (){//用get接收json数据 return axios.get('banner.json'); }2.请求拦截接口参数:参考图片
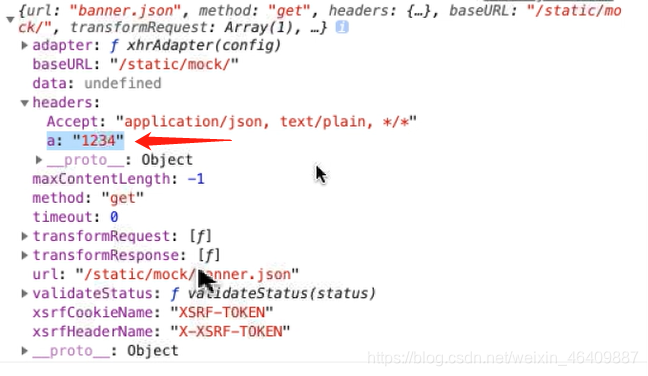
3.methods方法那里可以省略data部分
//当你在公共方法index.js定义后才可以省略data
methods:{//方法 getb(){ return getBanner().then((res)=>{ this.bannerlist=res.banner; }) } }4.在index.js中创建公共的接口名之后:
index.js中这一步可以省略前面的static/moke/
//导出一个axios有很多,所以必须分开用变量来接收,不用default是导出全部export let getBanner=function (){//用get接收json数据 return axios.get('banner.json');//省略后的}export let getBanners=function (){//用get接收json数据 return axios.get('banner.json');//省略后的 } ... export可以抛出很多数据...